Independent aerial evidence to support deer management decisions
Thermal drone surveying provides a repeatable, evidence-based baseline of deer presence, distribution and density across an estate. It is designed to complement on-the-ground knowledge, not replace it.
Detections are identified using thermal imagery, supported by RGB confirmation where possible, and mapped into GIS-ready outputs that can be reviewed, shared and compared over time.
Repeatable coverage
Structured block-based survey planning designed to support full and repeatable coverage.
Thermal + RGB
Thermal detection supported by RGB imagery where possible for additional confidence.
GIS-ready outputs
KML / mapped outputs that can be opened in Google Earth or incorporated into GIS workflows.
Minimum confirmed counts
Counts should be treated as minimum confirmed numbers, particularly in denser woodland.
In woodland, low-access areas and visually complex terrain, thermal often reveals deer that would otherwise be difficult to locate reliably from the ground or standard aerial imagery alone.
Estate, woodland and conservation survey experience
Thermal deer survey work has been undertaken across estate, woodland and conservation settings, including Drumlanrig, Hopetoun and National Trust-managed land.
The value of the method is not simply the count itself. It is the ability to provide mapped, repeatable evidence that can sit alongside keeper knowledge, estate records, habitat observations and woodland management objectives.
Thermal surveys sit alongside traditional counts
The strongest approach is not one method replacing another. It is combining local field knowledge, stalking records, habitat understanding and independent aerial evidence to support more defensible deer management decisions.
Ground knowledge remains valuable
Rangers, keepers and estate teams hold essential site knowledge, seasonal context and behavioural insight.
Visibility can still limit counts
Woodland cover, terrain, access, observer position and light conditions can all reduce detectability.
Thermal adds an evidence layer
Thermal detection helps locate deer, map their distribution and provide a repeatable baseline.
Outputs can be compared over time
Repeat surveys allow direct comparison across seasons, years or following management interventions.
Supporting funded deer management and woodland protection
Deer management is increasingly linked to woodland condition, natural regeneration, biodiversity targets and funded land management schemes. A thermal drone survey can provide a mapped, independent evidence layer to support Deer Management Plans, Species Management Plans, Habitat Impact Assessments and grant discussions.
In Scotland, Forestry Grant Scheme guidance for Deer Management Plans states that plans must be based on an accurate, independent third-party assessment of deer densities. In England, Countryside Stewardship Higher Tier includes CWS1 Deer Control and Management, currently paying £105 per hectare per year for 10 years where deer are causing harm to priority species and habitats.
Independent baseline
Mapped count, distribution and density evidence that can support deer management planning.
Grant-ready outputs
Survey report, detection maps, KML/KMZ files, density summaries and thermal/RGB evidence.
Repeat monitoring
Useful for tracking management effectiveness, reviewing browsing pressure and comparing results over time.
A thermal survey does not guarantee grant eligibility, but it can provide the kind of independent, mapped evidence that land managers increasingly need when preparing deer management plans, habitat assessments and funding applications.
How the survey works
Each survey is planned in advance using a structured, block-based approach. Woodland can be flown with tighter transect spacing to account for canopy cover and reduced visibility, helping support consistent coverage and reduce the risk of double counting.
Define the survey area
Estate blocks, compartments, woodland sections and operational constraints are mapped in advance.
Plan repeatable flight blocks
Systematic flight lines are designed to support full coverage and a defensible, repeatable methodology.
Detect using thermal
Thermal imagery isolates heat signatures that may be difficult or impossible to detect in standard imagery.
Use RGB for added confirmation
Where possible, RGB imagery is used to help confirm species, group size and context.
Map detections
Confirmed deer detections are geolocated and plotted into GIS-ready outputs such as KML/KMZ.
Report counts and density
Survey outputs can include total deer observed, mapped detections, density summaries and repeat-monitoring baselines.
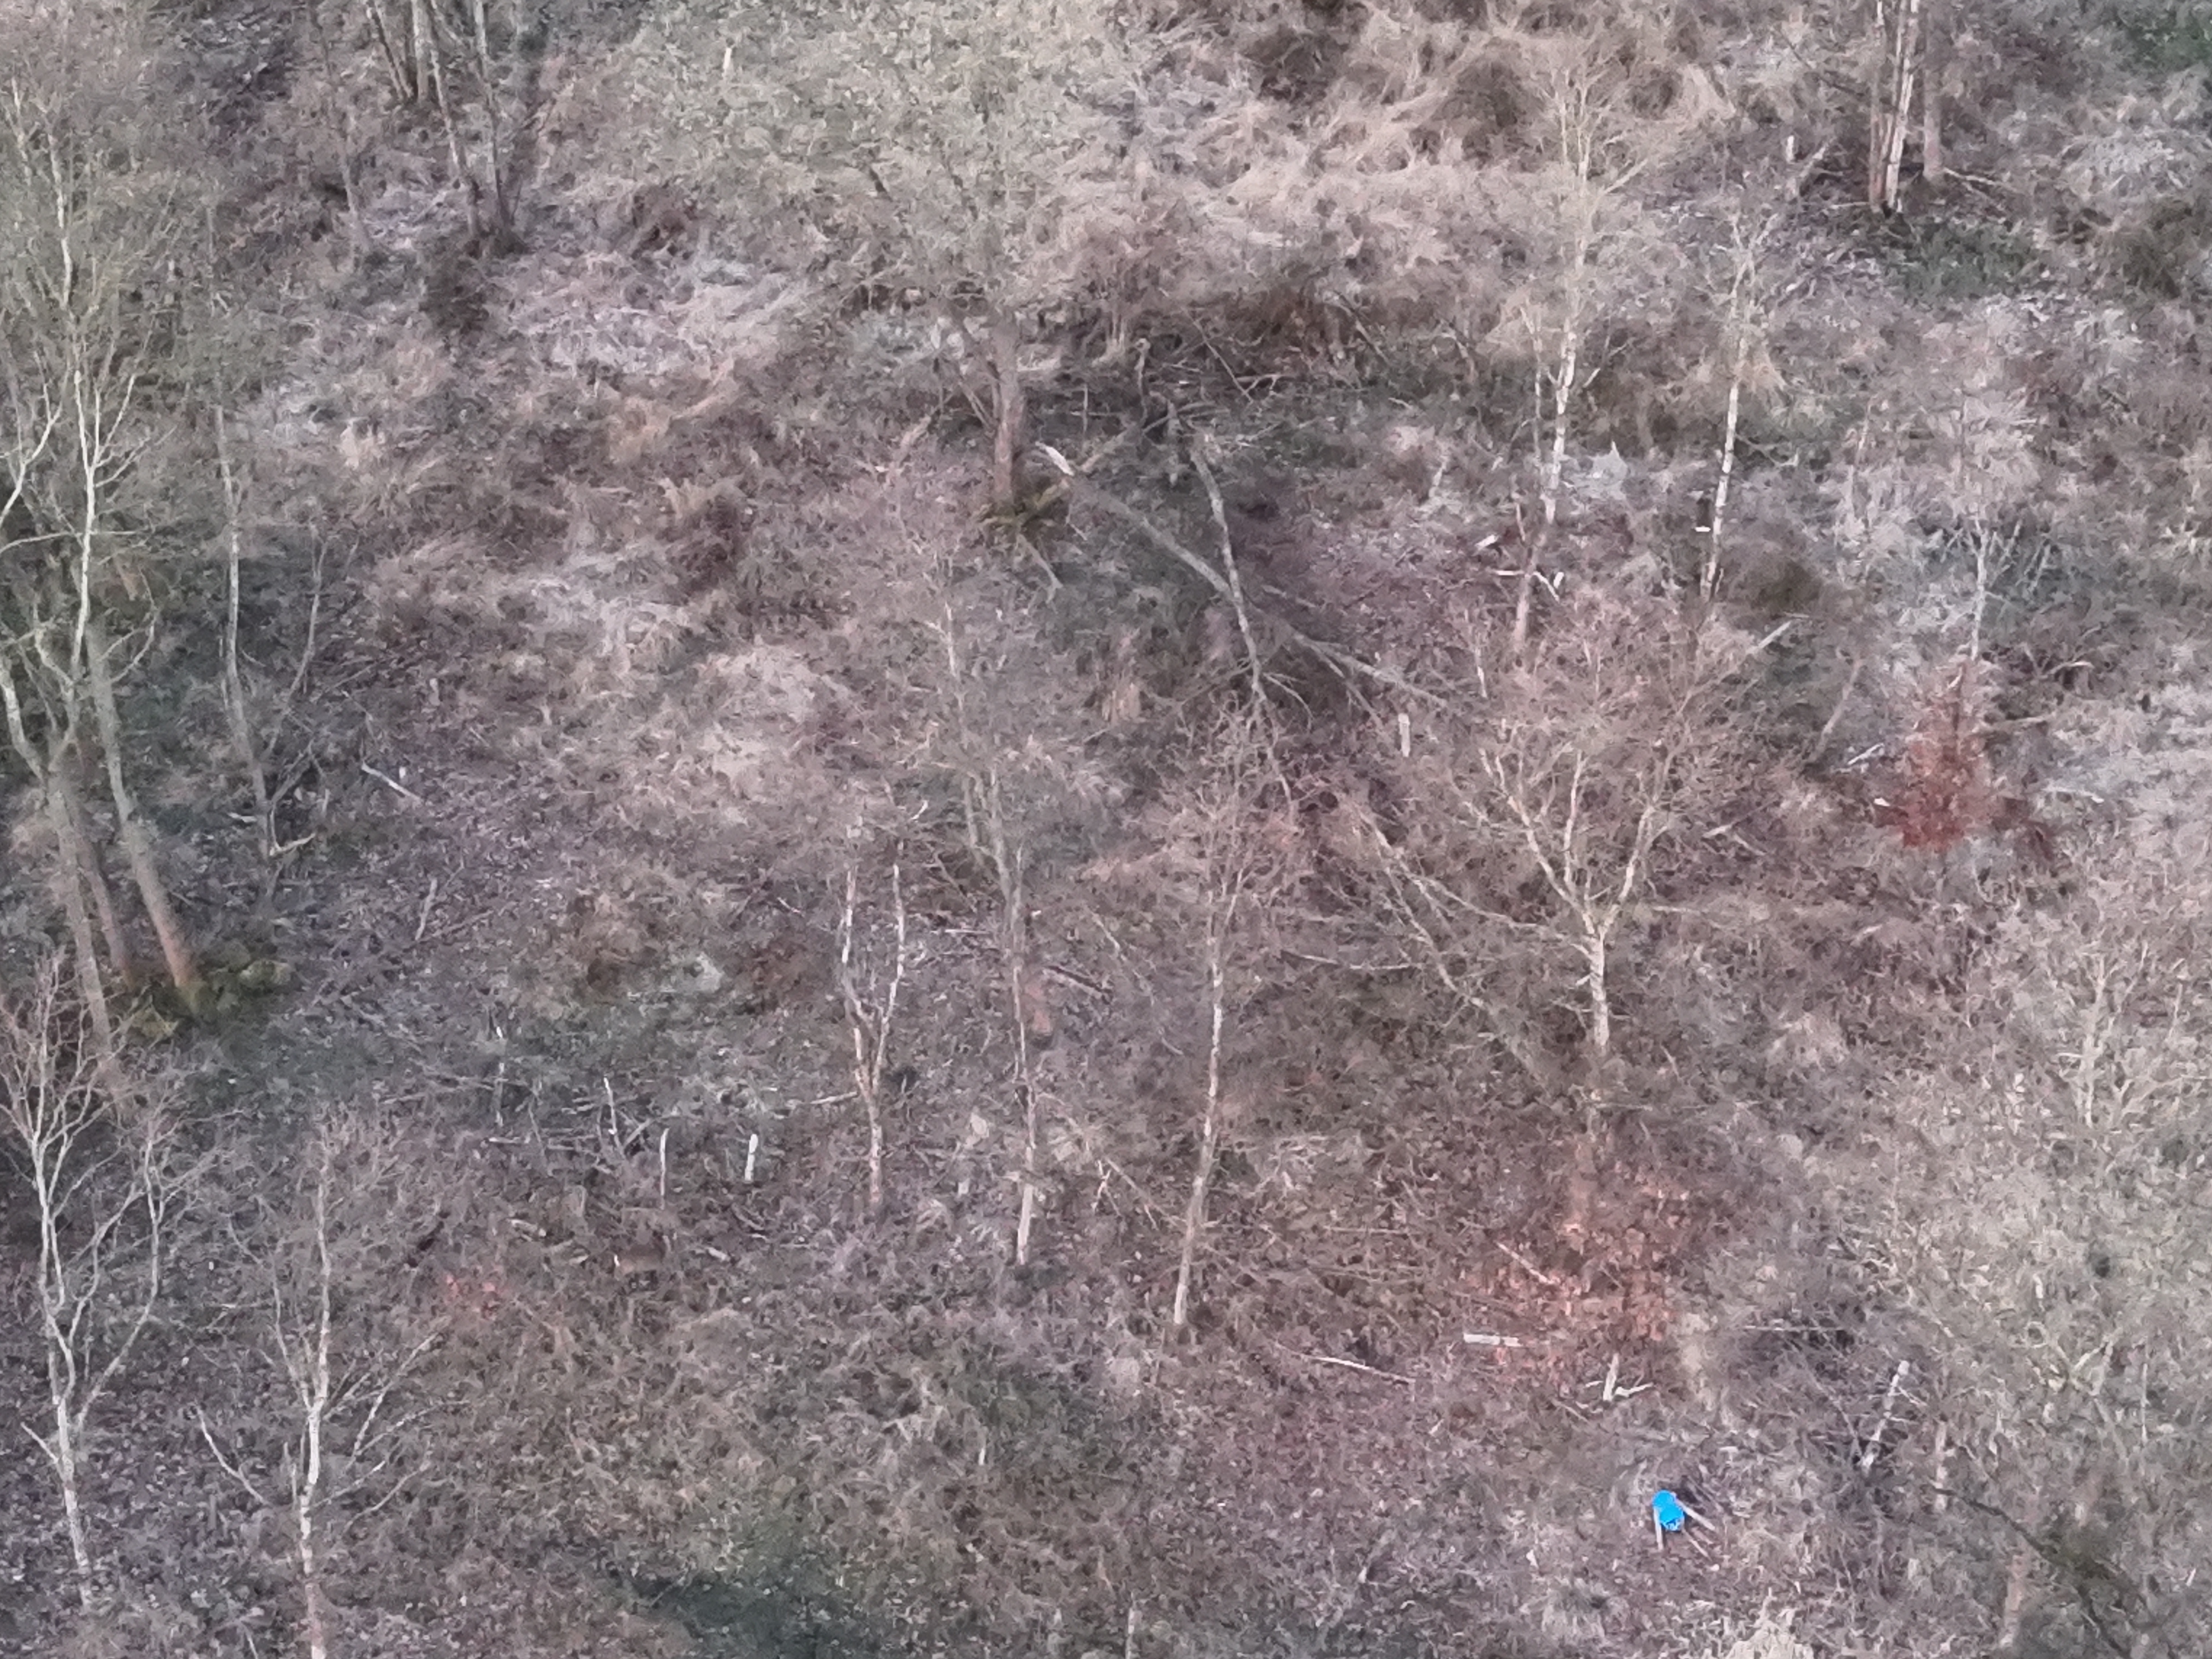
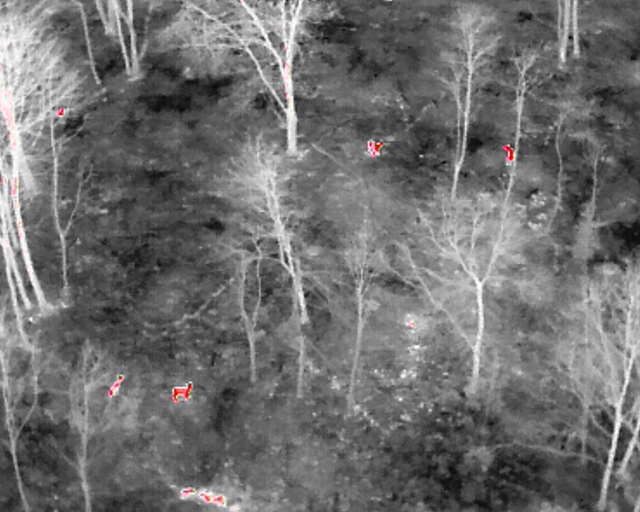
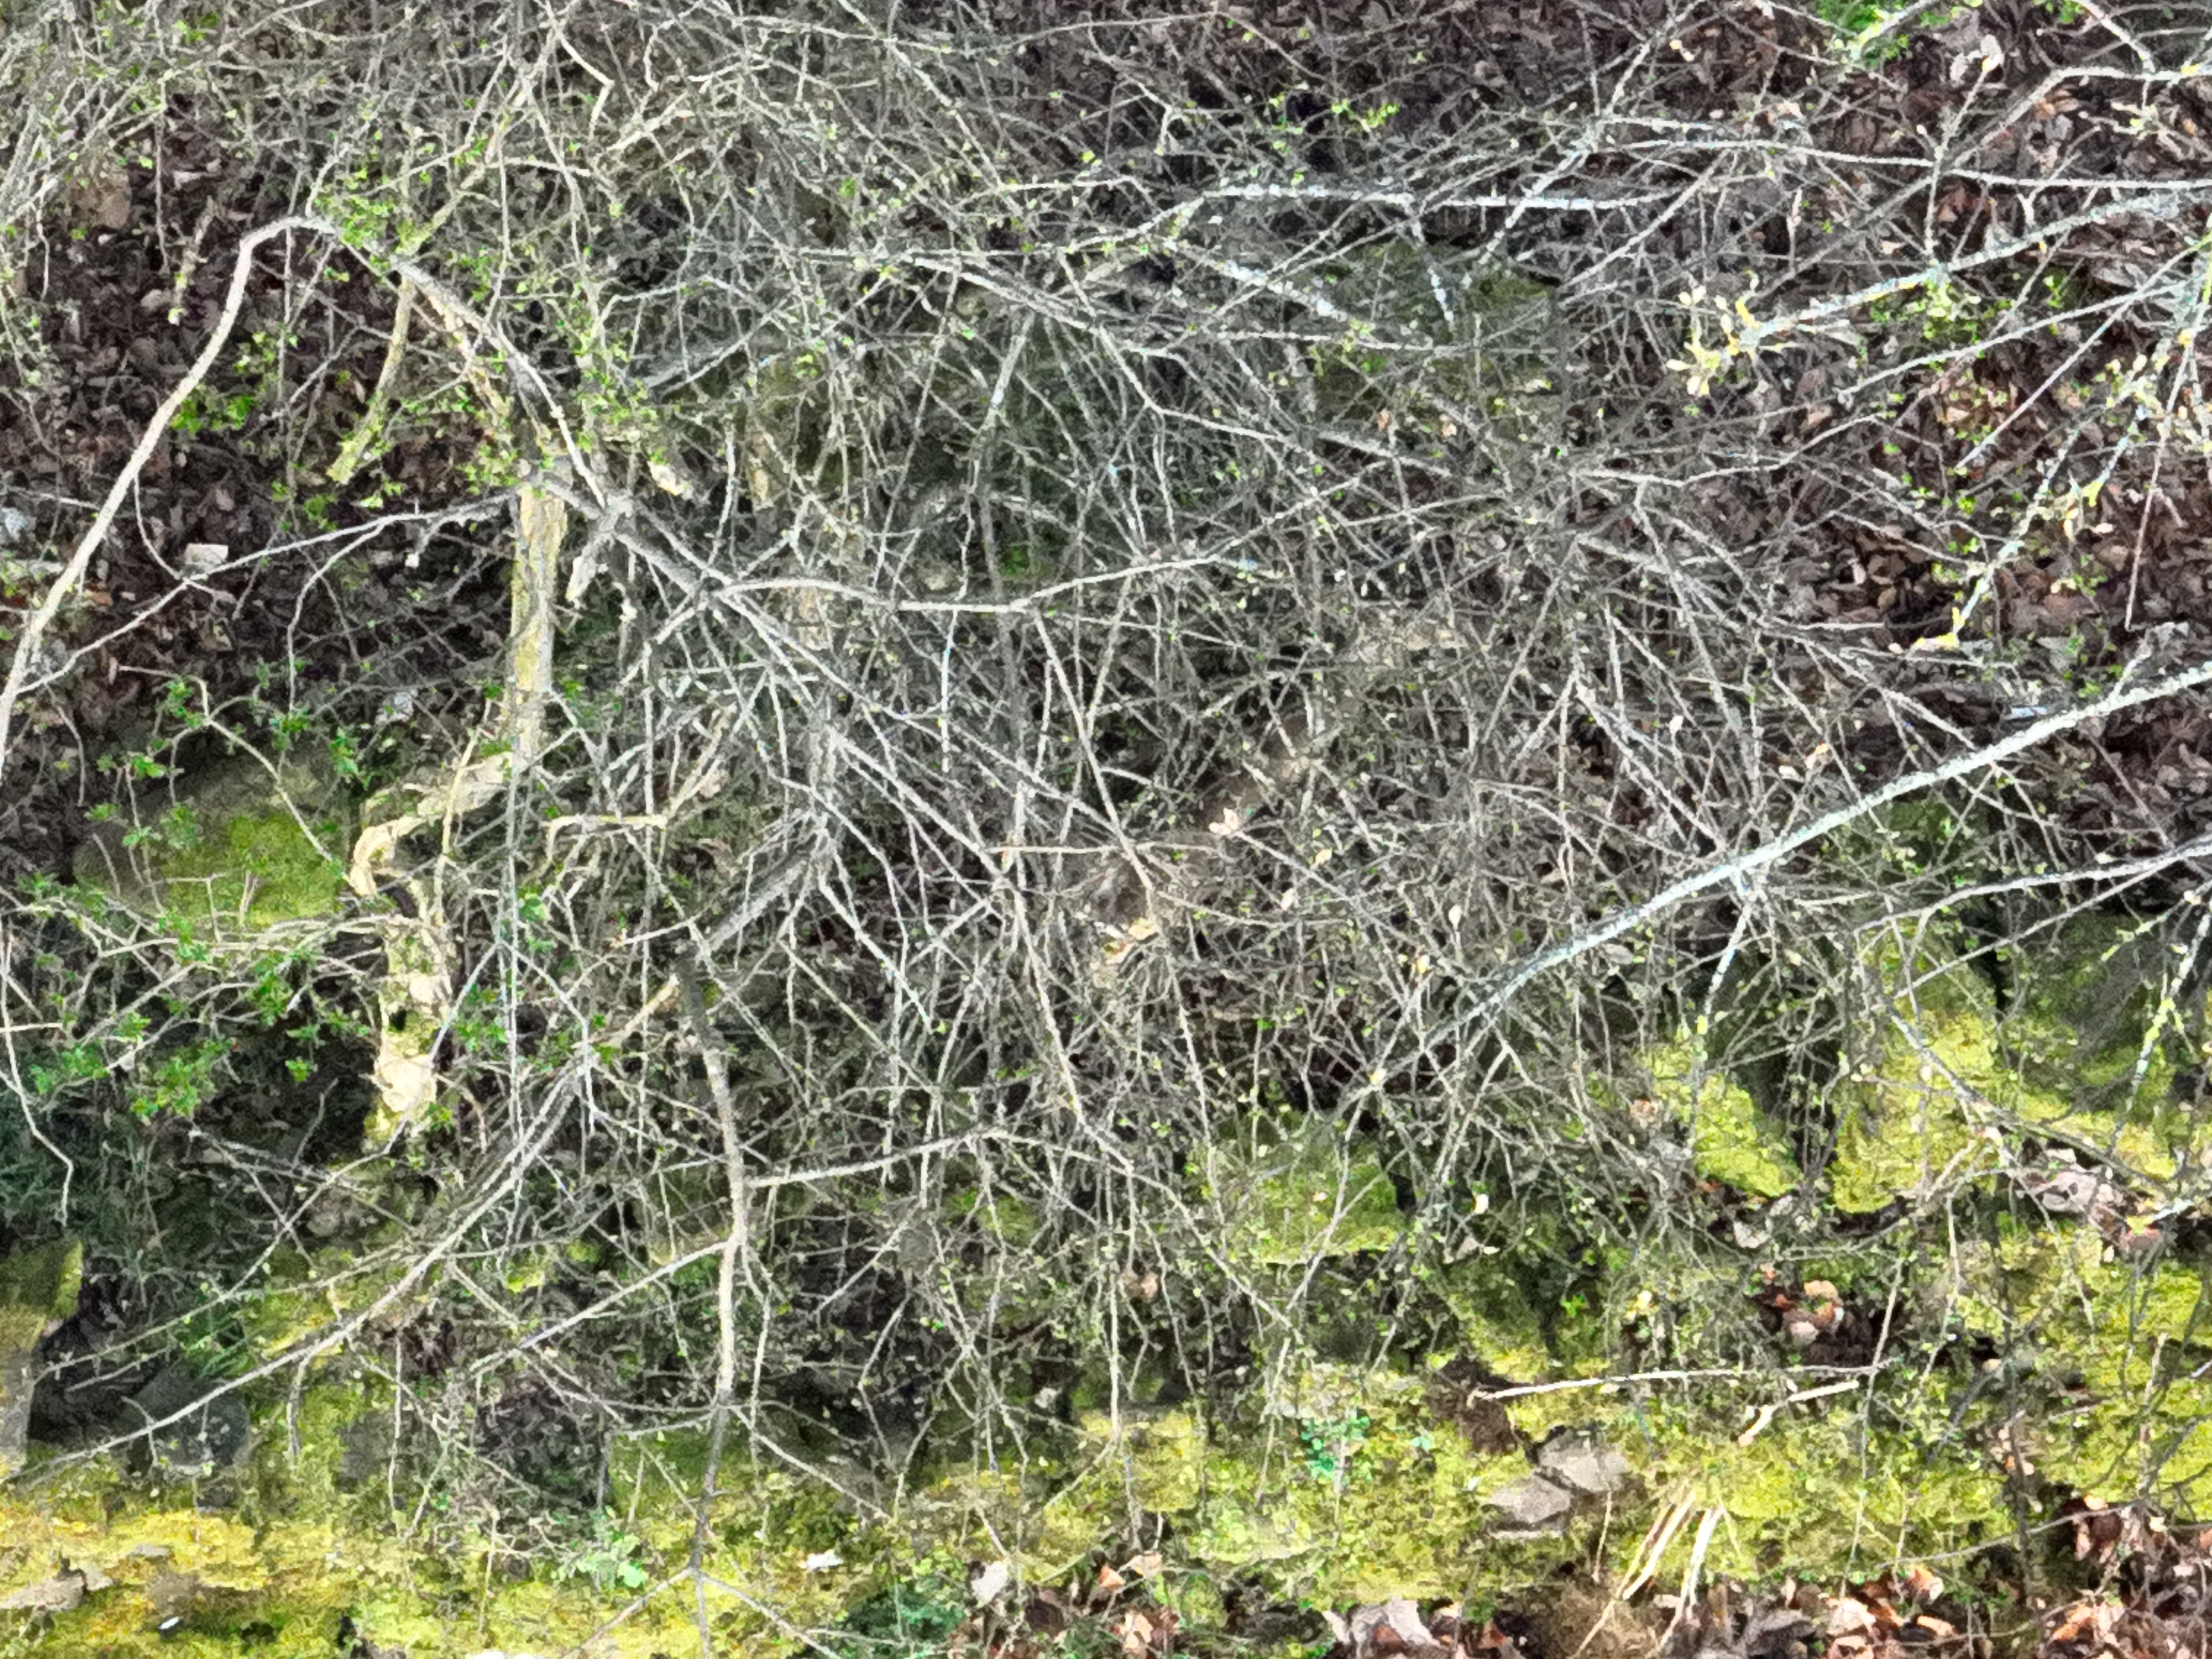
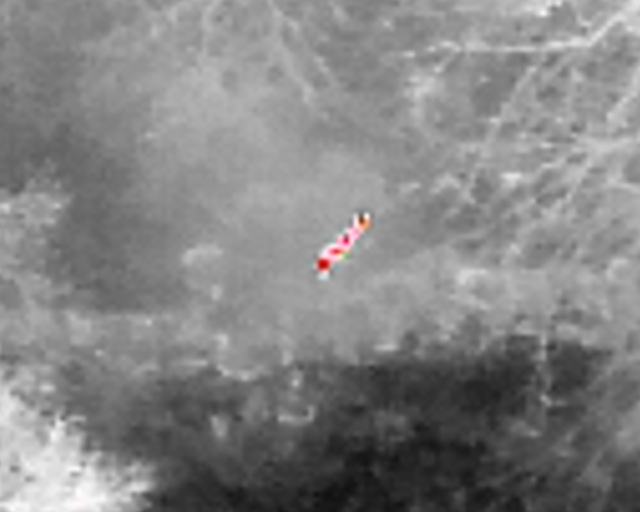
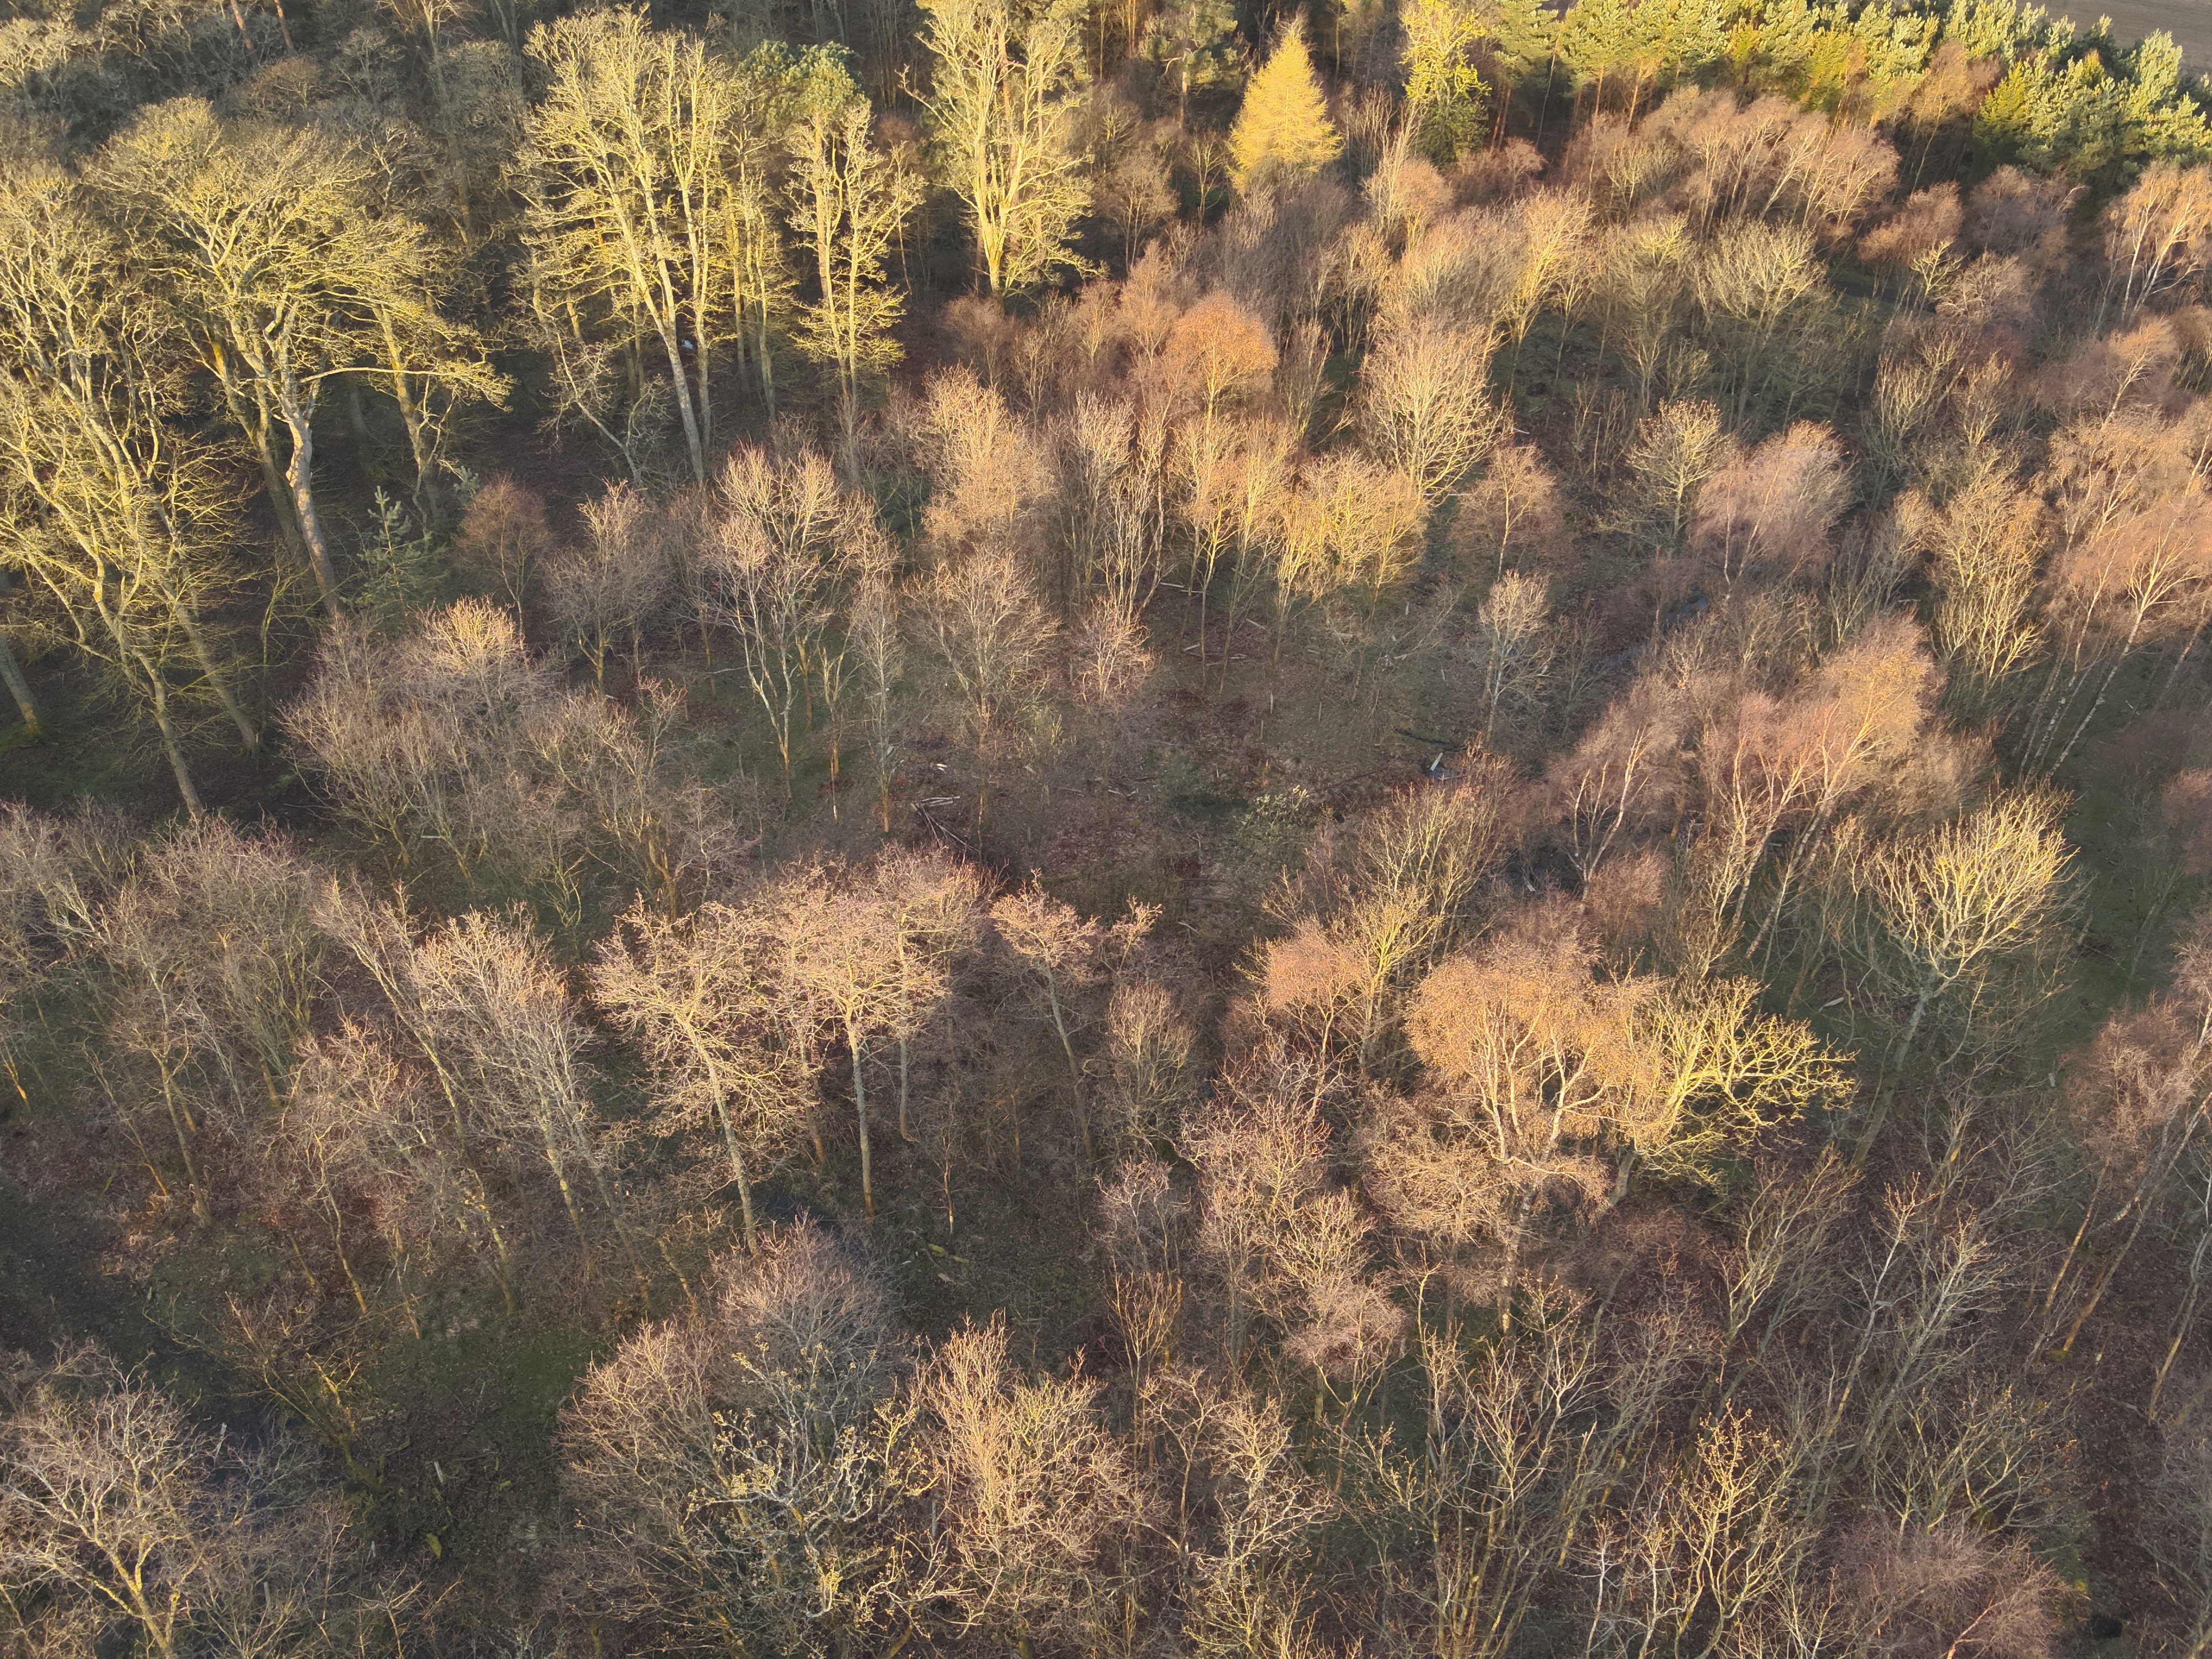
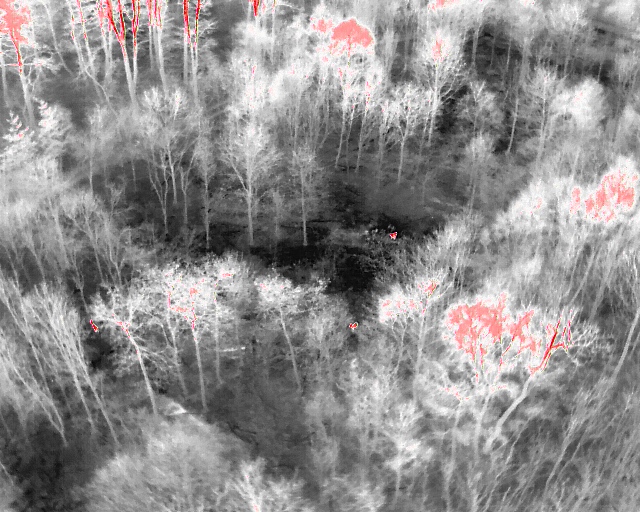
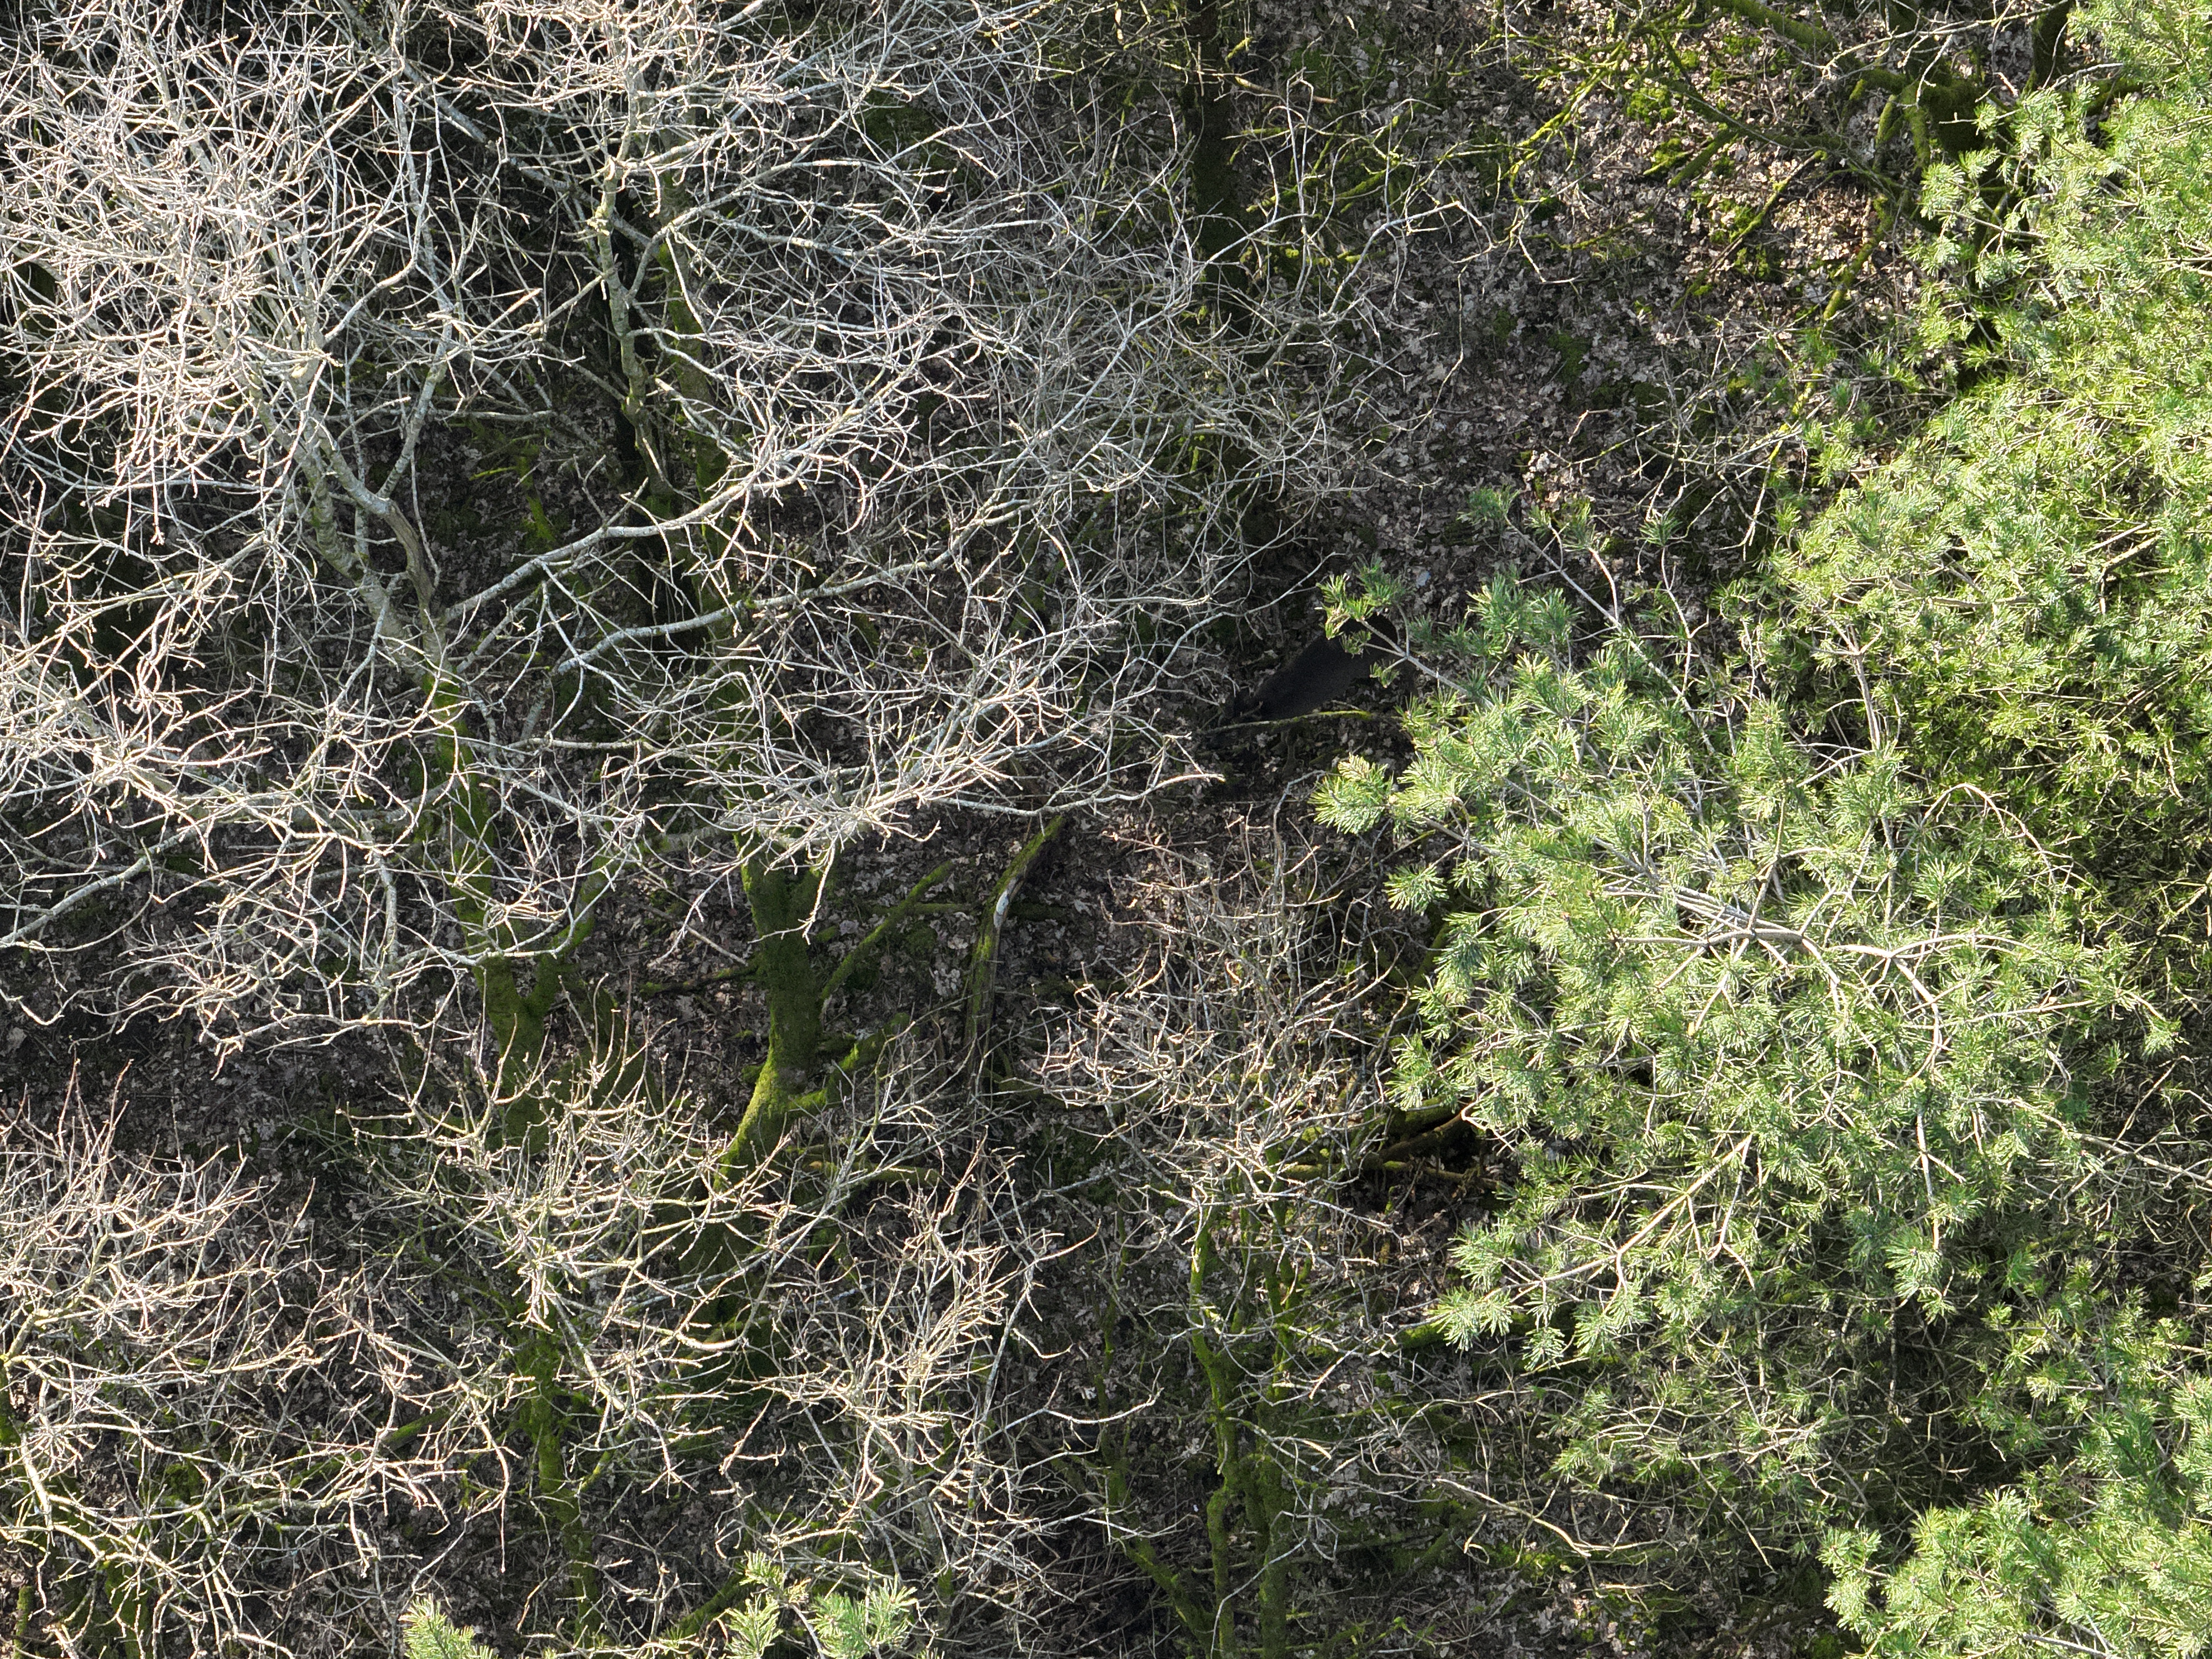
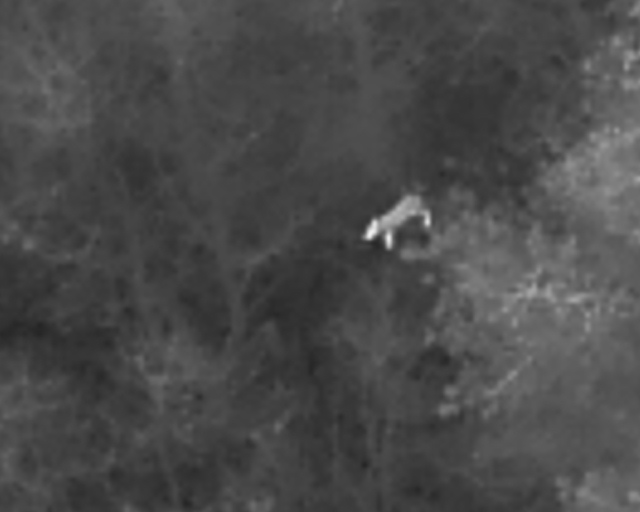
Compare RGB and thermal imagery
Drag the slider on each example to compare standard RGB imagery against thermal imagery. These examples show why thermal detection can be so valuable in woodland and visually complex environments.
See the method in action
These examples show how deer respond to the drone during accurate detection range, and how switching between thermal and RGB can aid detection over sensitive woodland.
Little disturbance during detection
This video shows deer within accurate detection range. The deer do not react to the drone’s presence, illustrating the low-disturbance nature of the method when operated appropriately.
SSSI woodland: thermal and RGB switching
This video shows switching between thermal and RGB imagery while surveying woodland SSSI habitat. It demonstrates how thermal aids initial detection, with RGB then providing additional confirmation and context.
From detection to mapped evidence
Every confirmed detection can be geolocated and supplied as a GIS-ready output. This makes the results easy to review in Google Earth or integrate into other estate mapping systems.
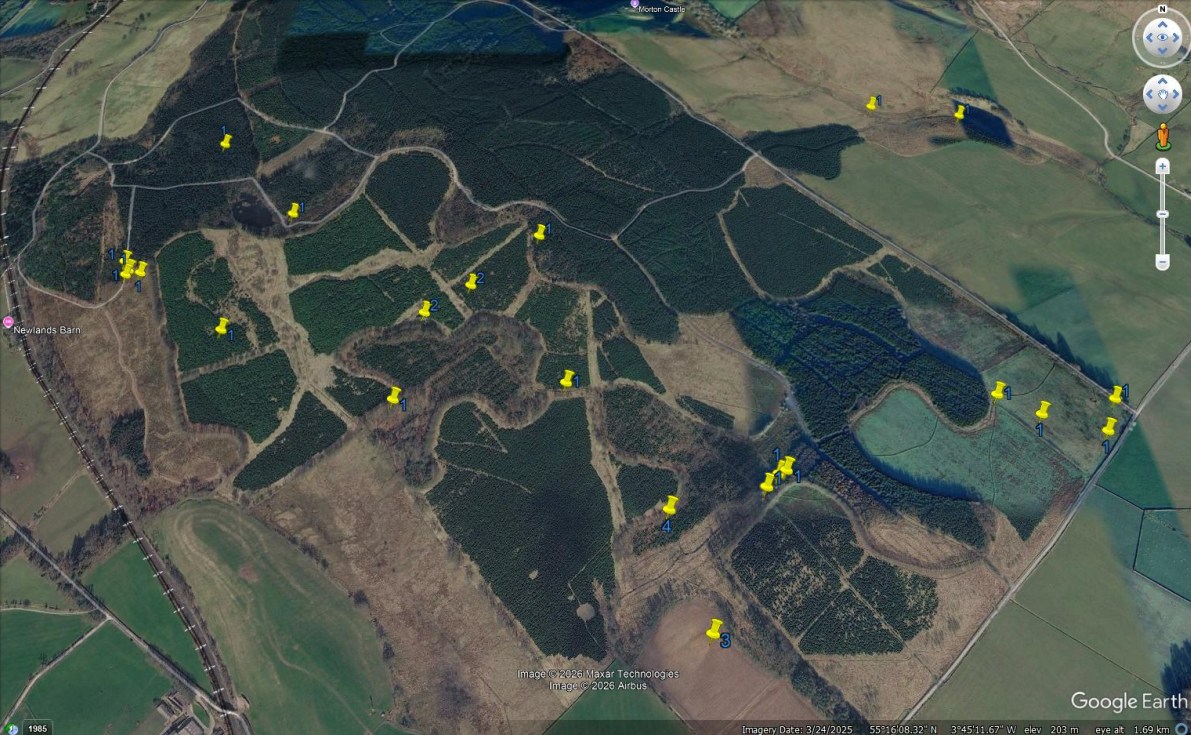
Example KML / mapping output
Detections can be supplied as GIS-ready files, allowing estate teams, land agents and woodland managers to view exact locations, identify concentrations of deer activity and compare results over time.
- Exact detection locations
- Number of deer at each point
- Optional grouping by survey block
- Compatible with Google Earth
- Useful alongside existing estate data layers
Clear breakdowns and density summaries
Survey outputs can include a straightforward summary of area surveyed, deer observed and density figures. This supports reporting, baseline comparison and practical management planning.
| Survey Section | Area (ha) | Deer Observed | Density (deer / km²) |
|---|---|---|---|
| Northern Section | 315 | 52 | 16.5 |
| Central Section | 50 | 22 | 44.0 |
| Southern Section | 90 | 0 | 0.0 |
| Total / Overall | 455 | 74 | 16.3 |
Thermal surveys can validate or refine existing estimates
Thermal drone surveys are designed to complement on-the-ground knowledge. In some cases they closely validate existing understanding; in others, especially in woodland, they reveal significantly more deer than expected.
Woodland example
During one survey, the on-site ranger estimated approximately 6 roe deer within a section of woodland. Within the same survey window, thermal surveying identified and confirmed 23 roe deer.
What this shows: visually complex woodland can significantly reduce detectability from the ground.
Mixed estate example
On another survey, the head gamekeeper estimated approximately 30 red deer and 200 fallow deer. Thermal survey identified 32 red deer and 190 fallow deer.
What this shows: in open or well-understood areas, thermal often validates existing local knowledge.
The strongest outcome is not “drone counts instead of traditional counts”. It is a more complete and defensible picture created by combining local field knowledge with independently derived aerial evidence.
Practical outputs for management and reporting
Outputs can be tailored to the site and objective, but a typical delivery can include mapped detections, summary reporting and GIS-ready files for future reference.
Survey report
Executive summary, methodology, results, limitations and interpretation.
Detection maps
Mapped outputs showing confirmed deer detections and spatial distribution.
KML / KMZ files
GIS-ready files suitable for Google Earth or wider estate mapping workflows.
Density summaries
Area-based reporting to support comparison over time and management planning.
Thermal / RGB evidence
Example imagery or clips demonstrating detections and confirmation workflow.
Repeatable baseline
A framework for future monitoring, whether seasonal, annual or post-intervention.
A defensible method, used with appropriate judgement
Thermal drone surveys are highly useful, but like any survey method they have limitations. They are best understood as providing minimum confirmed numbers, particularly in dense woodland or where thermal contrast is reduced by weather, canopy or time-of-day conditions.
Where the method is strongest
- Woodland and low-visibility areas
- Independent baseline counts
- Mapped spatial distribution
- Repeat monitoring over time
What still matters
- Weather and thermal contrast
- Canopy cover and habitat density
- Use of RGB for supporting confirmation
- Interpretation alongside local field knowledge
Interested in a pilot survey?
A pilot survey is often the simplest way to assess whether thermal drone deer surveying would provide useful evidence for your estate, woodland or conservation site.
Vista Metrics • Thermal Drone Surveying & Mapping